IECC Climate Zone Map (2021) and County Lookup
All 3,143 US counties and county-equivalents in PNNL’s list. Zones are the 2021 IECC designations from PNNL’s county guide for the U.S. Department of Energy. Your local code edition decides which map applies to a permit.
| Building America climate | — |
| Before the 2021 IECC | — |
| Winter design temp (99%) | — |
| Summer design temp (1%) | — |
| 2021 IECC limits | — |
2021 IECC climate zone map
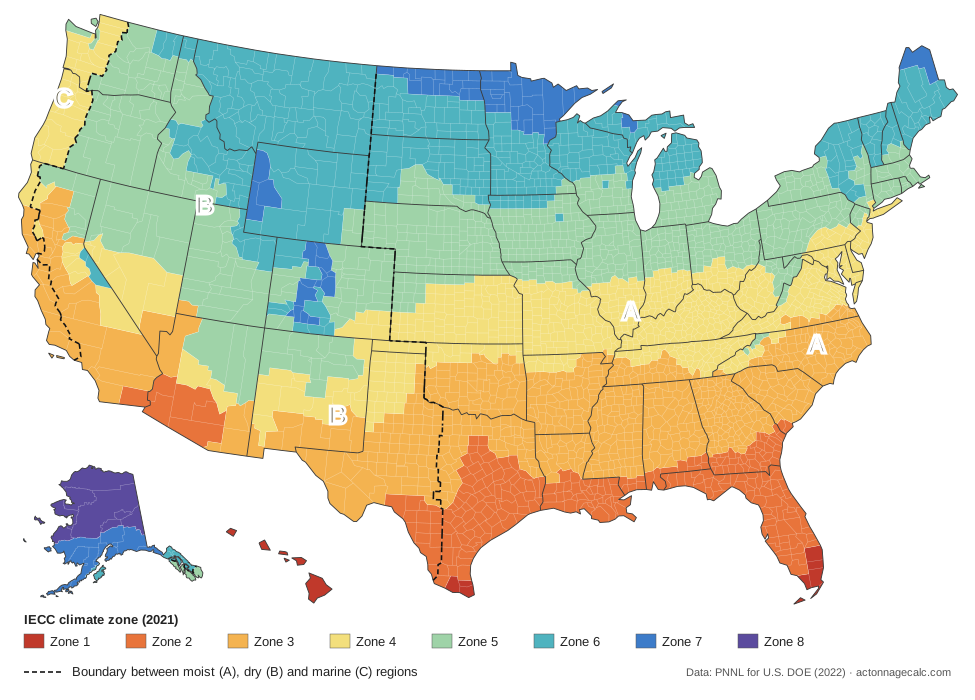
Climate zone chart
The eight zones, the moisture letters and Building America climate names found in each, how many counties fall in each, and the 2021 IECC’s maximum insulation U-factors and air leakage for a new home. A lower U-factor means better insulation.
| Zone | Letters | Building America climate | Counties | Example cities | Window U | Ceiling U | Wall U | Air leakage (ACH50) |
|---|---|---|---|---|---|---|---|---|
| Zone 1 | A | Hot-Humid | 12 | Miami, Honolulu | 0.50 | 0.035 | 0.084 | 5 |
| Zone 2 | A / B | Hot-Humid, Hot-Dry | 259 | Houston, Phoenix, Dallas | 0.40 | 0.026 | 0.084 | 5 |
| Zone 3 | A / B / C | Mixed-Humid, Hot-Humid, Hot-Dry, Marine | 761 | Los Angeles, Atlanta, Las Vegas, Nashville, San Francisco | 0.30 | 0.026 | 0.060 | 3 |
| Zone 4 | A / B / C | Mixed-Humid, Mixed-Dry, Marine, Cold | 821 | New York, Philadelphia, Seattle, Columbus, Washington, DC | 0.30 | 0.024 | 0.045 | 3 |
| Zone 5 | A / B / C | Cold, Marine | 788 | Chicago, Denver, Boston | 0.30 | 0.024 | 0.045 | 3 |
| Zone 6 | A / B | Cold | 425 | Minneapolis | 0.30 | 0.024 | 0.045 | 3 |
| Zone 7 | none | Very Cold | 69 | Anchorage | 0.30 | 0.024 | 0.045 | 3 |
| Zone 8 | none | Subarctic | 8 | Fairbanks | 0.30 | 0.024 | 0.045 | 3 |
U-factors: 2021 IECC Table R402.1.2 (frame walls, as reproduced by the ICC); air leakage: R402.4.1.2. Counties and examples: PNNL county data.
What the zones and letters mean
The IECC zones follow ASHRAE Standard 169 and are drawn on county lines. The number is set mainly by heating and cooling degree days; the letter by moisture. DOE’s Building America program groups them into eight named climates, which PNNL defines this way:
- Hot-humid (parts of zones 1A, 2A, 3A): more than 20 inches of rain a year and long periods of high wet-bulb temperature in the warm season.
- Mixed-humid (3A and 4A): more than 20 inches of rain, about 5,400 heating degree days or fewer, and winter months averaging below 45°F.
- Hot-dry (2B, 3B): less than 20 inches of rain and every month averaging above 45°F.
- Mixed-dry (4B): less than 20 inches of rain, about 5,400 heating degree days or fewer, and cold winter months.
- Cold (zones 5 and 6): 5,400 to 9,000 heating degree days. Very cold (zone 7): 9,000 to 12,600. Subarctic (zone 8, Alaska only): 12,600 or more.
- Marine (all “C” counties): mild winters, cool summers and a dry summer season.
Heating degree days on a 65°F base. Definitions summarised from PNNL-33270, section 2.2.1.
Climate zones of major US cities
| City | County | 2021 zone | Building America | Change in 2021 | Design temps (winter / summer) |
|---|---|---|---|---|---|
| New York | New York County, New York | 4A | Mixed-Humid | no change | 9°F / 92°F |
| Los Angeles | Los Angeles County, California | 3B | Hot-Dry | no change | 14°F / 102°F |
| Chicago | Cook County, Illinois | 5A | Cold | no change | -3°F / 91°F |
| Houston | Harris County, Texas | 2A | Hot-Humid | no change | 29°F / 97°F |
| Phoenix | Maricopa County, Arizona | 2B | Hot-Dry | no change | 24°F / 111°F |
| Philadelphia | Philadelphia County, Pennsylvania | 4A | Mixed-Humid | no change | 11°F / 91°F |
| Dallas | Dallas County, Texas | 2A | Hot-Humid | 3A → 2A | 22°F / 101°F |
| Miami | Miami-Dade County, Florida | 1A | Hot-Humid | no change | 48°F / 92°F |
| Atlanta | Fulton County, Georgia | 3A | Mixed-Humid | no change | 20°F / 92°F |
| Seattle | King County, Washington | 4C | Marine | no change | 11°F / 83°F |
| Denver | Denver County, Colorado | 5B | Cold | no change | -2°F / 93°F |
| Boston | Suffolk County, Massachusetts | 5A | Cold | no change | 1°F / 90°F |
| Minneapolis | Hennepin County, Minnesota | 6A | Cold | no change | -11°F / 89°F |
| Las Vegas | Clark County, Nevada | 3B | Hot-Dry | no change | 17°F / 116°F |
| Nashville | Davidson County, Tennessee | 3A | Mixed-Humid | 4A → 3A | 14°F / 97°F |
| Columbus | Franklin County, Ohio | 4A | Mixed-Humid | 5A → 4A | 5°F / 92°F |
| San Francisco | San Francisco County, California | 3C | Marine | no change | 32°F / 88°F |
| Washington, DC | District of Columbia, District of Columbia | 4A | Mixed-Humid | no change | 14°F / 94°F |
| Honolulu | Honolulu County, Hawaii | 1A | Hot-Humid | no change | 59°F / 90°F |
| Anchorage | Anchorage Municipality, Alaska | 7 | Very Cold | no change | -14°F / 80°F |
| Fairbanks | Fairbanks North Star County, Alaska | 8 | Subarctic | no change | -40°F / 80°F |
Design temperatures: 99% heating and 1% cooling values from EPA’s ENERGY STAR county reference guide (2019).
What changed in the 2021 IECC
The 2021 edition redrew the map with newer weather data. 374 counties changed zone: 347 moved to a warmer (lower) zone and 27 to a colder one. The most changes were in Wisconsin (45), North Carolina (34), Georgia (28), Iowa (25), Virginia (23), Tennessee (22). Moving to a warmer zone usually lowers the code’s insulation requirements a little, so check which edition your jurisdiction has adopted before you rely on the new zone.
Climate zones by state
Each state’s zones with the number of counties in each, and how many counties changed in 2021.
| State | Zones (counties) | Changed in 2021 |
|---|---|---|
| Alabama | 2A 9 · 3A 58 | 7 |
| Alaska | 5C 3 · 6A 7 · 7 11 · 8 8 | 13 |
| Arizona | 2B 5 · 3B 5 · 4B 2 · 5B 3 | — |
| Arkansas | 3A 63 · 4A 12 | — |
| California | 2B 1 · 3B 25 · 3C 14 · 4B 8 · 4C 2 · 5B 6 · 6B 2 | — |
| Colorado | 4B 5 · 5B 34 · 6B 12 · 7 13 | 3 |
| Connecticut | 5A 8 | — |
| Delaware | 4A 3 | — |
| District of Columbia | 4A 1 | — |
| Florida | 1A 4 · 2A 63 | 1 |
| Georgia | 2A 41 · 3A 118 | 28 |
| Hawaii | 1A 5 | — |
| Idaho | 5B 22 · 6B 22 | — |
| Illinois | 4A 44 · 5A 58 | 6 |
| Indiana | 4A 45 · 5A 47 | 15 |
| Iowa | 5A 84 · 6A 15 | 25 |
| Kansas | 4A 88 · 5A 17 | 10 |
| Kentucky | 4A 120 | — |
| Louisiana | 2A 37 · 3A 27 | — |
| Maine | 6A 15 · 7 1 | — |
| Maryland | 4A 22 · 5A 2 | 1 |
| Massachusetts | 5A 14 | — |
| Michigan | 5A 37 · 6A 44 · 7 2 | 12 |
| Minnesota | 5A 3 · 6A 61 · 7 23 | 10 |
| Mississippi | 2A 6 · 3A 76 | 1 |
| Missouri | 3A 2 · 4A 87 · 5A 26 | 6 |
| Montana | 6B 56 | — |
| Nebraska | 5A 93 | — |
| Nevada | 3B 1 · 4B 7 · 5B 9 | 7 |
| New Hampshire | 5A 5 · 6A 5 | 1 |
| New Jersey | 4A 14 · 5A 7 | 1 |
| New Mexico | 3B 8 · 4B 13 · 5B 12 | 2 |
| New York | 4A 8 · 5A 36 · 6A 18 | 8 |
| North Carolina | 3A 79 · 4A 16 · 5A 5 | 34 |
| North Dakota | 6A 37 · 7 16 | 14 |
| Ohio | 4A 24 · 5A 64 | 15 |
| Oklahoma | 3A 59 · 4A 15 · 4B 3 | 15 |
| Oregon | 4C 18 · 5B 18 | — |
| Pennsylvania | 4A 14 · 5A 53 | 16 |
| Rhode Island | 5A 5 | — |
| South Carolina | 2A 2 · 3A 44 | 2 |
| South Dakota | 5A 18 · 6A 48 | 5 |
| Tennessee | 3A 34 · 4A 61 | 22 |
| Texas | 1A 3 · 2A 81 · 2B 14 · 3A 58 · 3B 70 · 4B 28 | 8 |
| Utah | 3B 1 · 5B 21 · 6B 7 | 3 |
| Vermont | 6A 14 | — |
| Virginia | 3A 19 · 4A 111 · 5A 4 | 23 |
| Washington | 4C 14 · 5B 18 · 5C 4 · 6B 3 | 5 |
| West Virginia | 4A 36 · 5A 19 | 9 |
| Wisconsin | 5A 30 · 6A 42 | 45 |
| Wyoming | 5B 3 · 6B 17 · 7 3 | 1 |
About the data
Zones come from PNNL’s county data files for the 2021 IECC, checked county by county against the tables in PNNL’s published guide; the two agree for all but two counties. For those (Lane County, Kansas and Mercer County, New Jersey) we use the guide’s zone 4, which New Jersey’s own code bulletin confirms for Mercer. Bedford, Virginia, which merged into Bedford County in 2013, uses the county’s zone. Aleutians West Census Area, Alaska, has no row in the ENERGY STAR guide, so the lookup shows its zone without design temperatures. Puerto Rico and Guam are not included. Design temperatures are from EPA’s ENERGY STAR reference guide.
FAQ
What climate zone am I in?
It depends on your county. Pick your state and county in the lookup above to see its 2021 IECC zone. For example, Chicago (Cook County) is 5A, Houston (Harris County) is 2A and Seattle (King County) is 4C.
How many climate zones are there in the US?
Eight, numbered 1 (hottest) to 8 (coldest), mostly split by a letter for moisture: A (moist), B (dry) or C (marine). Zones 7 and 8 have no letter. Of the 3,143 counties in PNNL’s list, zone 4 has the most (821) and zone 8 the fewest (8, all in Alaska).
What do A, B and C mean in a climate zone?
They describe moisture. A is moist (the East and Gulf Coast), B is dry (most of the West) and C is marine (the coastal Pacific Northwest and parts of coastal California), where winters are mild and wet and summers are cool and dry.
Did climate zones change in 2021?
Yes. The 2021 IECC updated the map with newer weather data. 374 of 3,143 counties changed zone: 347 moved to a warmer (lower) zone and 27 to a colder one. Dallas went from 3A to 2A, Nashville from 4A to 3A and Columbus, Ohio from 5A to 4A. Which map applies to your project depends on the code edition your state or city has adopted.
What climate zone is Chicago? What about New York or Phoenix?
Chicago (Cook County) is 5A, New York City (New York County) is 4A, Phoenix (Maricopa County) is 2B, Denver is 5B, Atlanta (Fulton County) is 3A and Miami-Dade is 1A. The table above lists more cities.
Does the climate zone decide my AC or furnace size?
Not directly. The zone sets building-code requirements such as insulation and air sealing. Equipment size comes from a load calculation at your county’s design temperatures, which our furnace, heat pump and HVAC load calculators use. Picking your county in those tools now also sets its climate zone.
Sources
Official sources only, checked October 2026.
- PNNL-33270: Guide to Determining Climate Zones by County, Building America and IECC 2021 Updates (U.S. DOE, 2022) — county designations, 2018→2021 changes, Building America climate definitions
- PNNL: climate zone county data files (GIS) — county-level 2021 and pre-2021 zones used for the map and lookup
- 2021 IECC Table R402.1.2 maximum assembly U-factors and R402.4.1.2 air leakage, as reproduced by the ICC — U-factors for windows, ceilings, walls and floors by climate zone; 5.0 ACH50 in zones 0–2, 3.0 ACH50 in zones 3–8
- ENERGY STAR Design Temperature Limit Reference Guide, 2019 Edition (U.S. EPA) — 99% heating and 1% cooling design temperatures and HDD/CDD ratio by county; EPA compiled them from ASHRAE 2017 Handbook and ACCA Manual J 8th Ed. design conditions
- New Jersey DCA, Division of Codes and Standards: Bulletin 22-1 — lists Mercer County in zone 4A, confirming the PNNL guide table over the GIS file
actonnagecalc.com is not affiliated with, or endorsed by, the U.S. EPA, ENERGY STAR®, DOE, PNNL or the ICC. Their publications are cited as sources.
Updated 6 November 2026